
Introduction
Amazon recently launched a new Brand Metrics beta, which enables brands to see their performance across different categories in new ways.
The new feature can be accessed via the left-hand side of the advertising console and contains a selection of interesting new insights. It’s currently in beta but here’s a first look.
Category level engagement and conversion
Once inside the new Brand Metrics area in the advertising console, marketers can view a list of the categories in which they have shoppers, and the number of engagements they are driving from each category. It’s important to note that this data comes from retail and advertising data and so gives you a view of overall behaviour and is not only limited to those shoppers who’ve interacted with your ads. Brand Metrics offers insights on the engaged shopper rate, which is the proportion of the total shoppers that your brand has driven any kind of engagement from, from within that segment. Simply put, the higher this number, the greater your reach is within your potential audience. This gives you a broader idea of the size of the potential addressable audience.
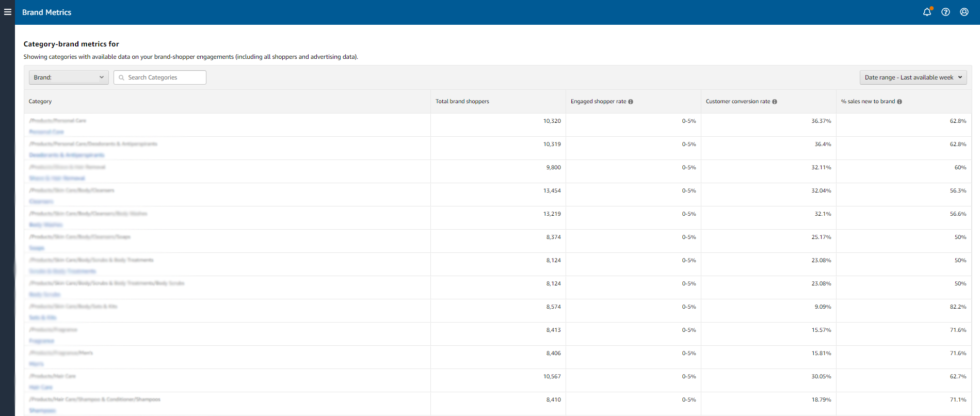
The main screen also displays the conversion rate your brand has within each category, based on users who have considered or engaged with you before moving on to purchase a product. This can help you understand which of your product types are converting better, as well as give a top-level view of engagement and conversion for the different categories side by side.
Category benchmarks and funnel analysis
Every category can be explored further by clicking in where you’ll find the data broken out further with some additional insights.
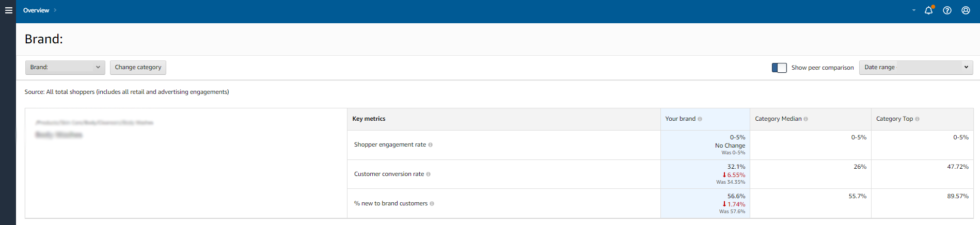
At the top, you’ll notice those metrics from the first page (shopper engagement rate, conversion rate, and new to brand) with the addition of some benchmarking data that allows you to see how that brand measures up versus other sellers and vendors in the category. You get this data in the form of benchmarks for the 50th percentile (the category average score) and then the 95-99th percentile (the top-performing brands). The date toggle means you can look back over time and get an indication of how you’re trending.
Key funnel metrics
Further down the page we get a funnel view broken out for awareness, consideration and purchased based on the KPIs Amazon deems important to each stage.
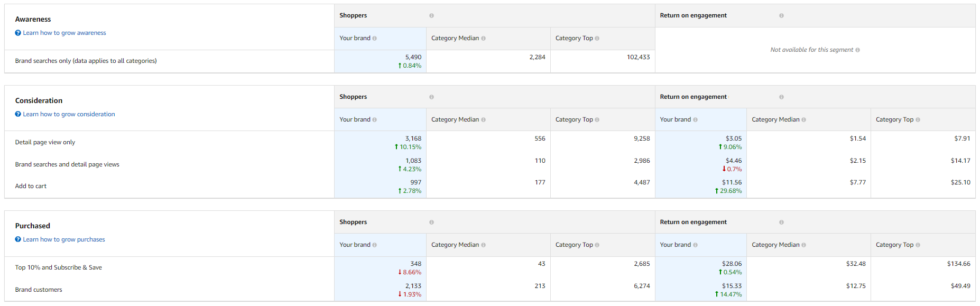
Firstly, the Awareness table shows you the number of brand searches you received in comparison to other brands, which gives an indication of how aware Amazon shoppers are of your brand. Using the same ‘average’ – 50th percentile tells marketers how their brand awareness compares to brands in that category…
There is also a ‘return on engagement’ metric that shows you the average value to your brand based on shopper’s engagements within the previous rolling 12 months.
The engagements used for Consideration are based around detail page views (DPVs) brand searches & add to-carts and for Purchase, it considers the top 10% and subscribe & save and brand customers. The data points remain the same and again we can see how we compare category median and category top as well those new return on engagement metrics.
So that’s a quick first look at the main features of the Brand Metrics beta. It’s another example of Amazon’s ongoing efforts to empower advertisers by revealing more of the rich shopping data they have. For any questions on Amazon Sponsored Ads or your wider Amazon strategy, please get in touch with our Amazon team!


